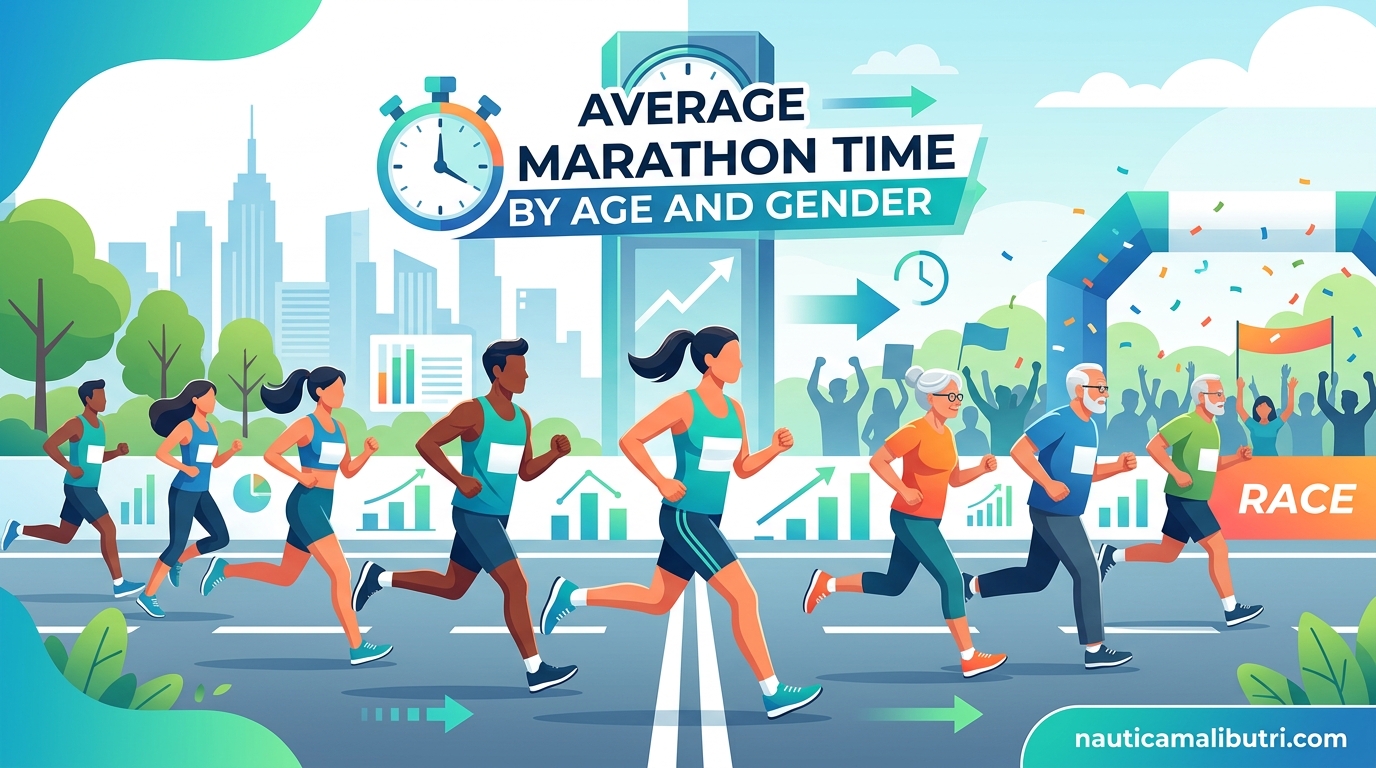
The average marathon time across all ages and genders is 4 hours 29 minutes 53 seconds. Breaking this down by gender, men typically finish in around 4:21:03 while women average 4:48:45. These figures come from analyzing over 19 million marathon results worldwide, giving us a comprehensive picture of how recreational runners actually perform on race day.
Understanding average marathon time by age and gender matters for anyone training for their first 26.2-mile race or looking to set realistic goals. Raw finishing times only tell part of the story. A 4-hour marathon means something very different for a 25-year-old man versus a 55-year-old woman. Age-graded scoring and ability-level benchmarks provide much better context for evaluating your performance.
At Nautica Malibu Triathlon, we see marathon training from a unique perspective. Many of our athletes come from triathlon backgrounds where the marathon represents the final leg of an Ironman. Whether you are training for a standalone marathon or preparing for that 26.2-mile run after a 2.4-mile swim and 112-mile bike, knowing where you stand compared to other runners your age helps you plan smarter and race better.
Table of Contents
Average Marathon Time Overview
Global marathon data reveals clear patterns in how finish times cluster across different demographics. The overall average of 4:29:53 translates to roughly 10:18 per mile or 6:24 per kilometer. Most recreational runners fall between 3:30 and 5:30, with the distribution peaking around the 4:15 to 4:45 range.
Men consistently finish 20 to 30 minutes faster than women across all age groups. This gap narrows slightly at older ages but remains significant due to physiological differences in VO2 max, muscle mass, and running economy. Elite men run approximately 2:05 to 2:10, while elite women run 2:15 to 2:25. These world-class times are roughly twice as fast as recreational averages.
| Category | Average Finish Time | Pace per Mile | Pace per KM |
|---|---|---|---|
| Overall Average (All Ages/Genders) | 4:29:53 | 10:18 | 6:24 |
| Men Average | 4:21:03 | 9:57 | 6:11 |
| Women Average | 4:48:45 | 11:00 | 6:50 |
| Beginner Men | 4:55:00 | 11:15 | 7:00 |
| Beginner Women | 5:30:00 | 12:35 | 7:49 |
| Elite Men | 2:05:00 | 4:46 | 2:58 |
| Elite Women | 2:20:00 | 5:21 | 3:19 |
Data from RunRepeat’s analysis of 19 million marathon finishers between 1986 and 2026 shows that average times have slowed slightly over the past decade. This reflects the democratization of the sport. More first-time runners are completing marathons, which pushes the overall average upward even as competitive times at the front remain steady.
Average Marathon Time for Men by Age Group
Men generally hit peak marathon performance in their late 20s to early 30s. The average time for men aged 30 to 39 sits around 4:04:00, representing the sweet spot where aerobic capacity, muscular endurance, and training experience converge. After age 40, times gradually increase by roughly 0.5 to 1 percent per year.
The following table breaks down average marathon finish times for men across different age brackets and ability levels. Beginner represents first-time or casual runners. Novice covers those with some consistent training. Intermediate reflects dedicated recreational runners. Advanced indicates competitive age-group athletes. Elite represents sub-elite and professional runners.
| Age Group | Beginner | Novice | Intermediate | Advanced | Elite |
|---|---|---|---|---|---|
| 20-29 | 4:45:00 | 4:15:00 | 3:45:00 | 3:15:00 | 2:45:00 |
| 30-39 | 4:50:00 | 4:20:00 | 3:50:00 | 3:20:00 | 2:50:00 |
| 40-49 | 5:00:00 | 4:30:00 | 4:00:00 | 3:30:00 | 3:00:00 |
| 50-59 | 5:20:00 | 4:50:00 | 4:20:00 | 3:50:00 | 3:20:00 |
| 60-69 | 5:45:00 | 5:15:00 | 4:45:00 | 4:15:00 | 3:45:00 |
| 70+ | 6:30:00 | 6:00:00 | 5:30:00 | 5:00:00 | 4:30:00 |
Men in their 20s often lack the aerobic base built through years of training, which explains why the 30 to 39 age group sometimes edges them out. By the 40s, recovery takes longer and maximum heart rate declines, though experience and efficiency can partially offset these changes. The 50 to 59 group still maintains impressive speed, with many dedicated runners finishing under 4 hours.
Master athletes in the 60 to 69 category who train consistently can still break 4:30, while the 70-plus runners completing marathons at any pace demonstrate remarkable endurance and longevity. Age-graded scoring systems adjust these times to show that a 65-year-old finishing in 4:45 may have performed equivalently to a 35-year-old running 3:30.
Average Marathon Time for Women by Age Group
Women follow a similar age-related performance curve to men, though the absolute times are typically 20 to 30 minutes slower across all age brackets. Female runners peak in their early 30s, with the 30 to 39 age group averaging around 4:22:00. The gender gap in marathon performance has narrowed slightly over the past two decades as more women take up serious competitive training.
The following table shows average marathon finish times for women by age and ability level. These figures reflect the growing depth of women’s distance running, with the intermediate category now packed with competitive recreational runners who train systematically.
| Age Group | Beginner | Novice | Intermediate | Advanced | Elite |
|---|---|---|---|---|---|
| 20-29 | 5:15:00 | 4:45:00 | 4:15:00 | 3:45:00 | 3:15:00 |
| 30-39 | 5:20:00 | 4:50:00 | 4:22:00 | 3:52:00 | 3:22:00 |
| 40-49 | 5:30:00 | 5:00:00 | 4:32:00 | 4:02:00 | 3:32:00 |
| 50-59 | 5:50:00 | 5:20:00 | 4:52:00 | 4:22:00 | 3:52:00 |
| 60-69 | 6:15:00 | 5:45:00 | 5:15:00 | 4:45:00 | 4:15:00 |
| 70+ | 7:00:00 | 6:30:00 | 6:00:00 | 5:30:00 | 5:00:00 |
Women in their 30s represent the largest and most competitive demographic in modern marathoning. Many in this age group balance careers and families while maintaining serious training schedules. The 40 to 49 category often shows surprising depth because these runners have built years of aerobic base and learned to train efficiently.
Women over 50 are the fastest-growing marathon demographic. Their times typically fall 15 to 20 percent behind their younger counterparts, but age-graded performances often match or exceed younger runners when adjusted for physiological norms. A 55-year-old woman running 4:45 has achieved an equivalent performance to a 35-year-old running around 4:10.
Marathon Ability Levels Explained
Raw finish times only tell part of the story. A 4-hour marathon means something different depending on your age, gender, and training history. Ability level classifications help you benchmark against runners with similar backgrounds and goals. The VDOT system developed by exercise physiologist Jack Daniels provides a scientific framework for categorizing runners based on VO2 max and lactate threshold.
Here is how ability levels break down for a 35-year-old male runner. Women and older runners would adjust their target times proportionally based on the age and gender tables above.
| Ability Level | Time Range (35M) | VDOT Range | Description |
|---|---|---|---|
| Beginner | 4:45-5:30 | 30-38 | First-time or casual runners, under 30 miles per week training |
| Novice | 4:15-4:45 | 38-45 | Recreational runners with 6-12 months consistent training |
| Intermediate | 3:45-4:15 | 45-52 | Dedicated runners, 40-50 miles per week, multiple marathons |
| Advanced | 3:15-3:45 | 52-60 | Competitive age-group athletes, structured training plans |
| Elite | 2:45-3:15 | 60-70 | Sub-elite and professional runners, lifelong athletic background |
| World Record | Under 2:02 | 85+ | World-class professional athletes, genetic outliers |
Age-graded scoring adds another dimension to ability assessment. This system calculates what percentage of the world record for your age and gender you achieved. A 70 percent age-graded score represents solid local competitive level. Scores above 80 percent indicate regional competitive ability. Anything over 90 percent approaches national-class performance.
The current world records stand at 2:00:35 for men (Kelvin Kiptum, Chicago 2023) and 2:09:56 for women (Tigst Assefa, Berlin 2023). These times are so far removed from recreational averages that they almost belong to a different sport entirely. Even elite recreational runners are typically 45 to 60 minutes slower than world record pace.
Understanding VDOT Levels
VDOT represents an estimate of your VO2 max based on race performance. It provides a single number that captures your current aerobic fitness level. A VDOT of 40 corresponds roughly to a 4-hour marathon, while VDOT 50 translates to approximately 3:25. Training paces for easy runs, tempo runs, and intervals are all calculated as percentages of your VDOT.
The beauty of VDOT is that it allows fair comparison across distances. A runner who completes a half marathon in 1:45 has approximately the same VDOT as someone who runs a 5K in 21:30. This makes it useful for predicting marathon times based on shorter race performances, though the accuracy decreases as the distance gap widens.
Marathon Times in Triathlon and Ironman Racing
Triathletes face a unique challenge when it comes to marathon performance. The marathon leg of an Ironman comes after a 2.4-mile swim and 112-mile bike ride. Even well-trained triathletes typically run 20 to 30 minutes slower than their standalone marathon times. This difference stems from accumulated fatigue, depleted glycogen stores, and the specific demands of pacing a full day of racing.
The average Ironman marathon split ranges from 4:30 to 5:30 for age-group athletes. Elite triathletes still manage sub-3-hour marathons off the bike, but this represents a 15 to 20 minute slowdown from their open marathon capability. The bike leg particularly affects running performance because cycling uses complementary but slightly different muscle groups while depleting the same energy systems.
For triathletes preparing for their first Ironman, planning a realistic marathon split is crucial. A common mistake is using standalone marathon times to pace the run leg, leading to early blow-ups and walk-shuffle finishes. The 10-10-10 rule becomes even more important in triathlon, where nutrition and hydration mistakes on the bike directly impact marathon performance.
Half Ironman races (70.3 distance) feature a 13.1-mile run instead of a full marathon. Average run splits here range from 1:40 to 2:20 for age-groupers. These times are typically 10 to 15 minutes slower than open half marathon times due to the preceding 1.2-mile swim and 56-mile bike.
Boston Marathon Qualifying Times
The Boston Marathon remains the holy grail for many recreational runners. Qualifying times vary by age and gender, with the standards updated periodically to manage field size. The following table shows the current qualifying standards for the 2026 Boston Marathon.
| Age Group | Men BQ Time | Women BQ Time |
|---|---|---|
| 18-34 | 3:00:00 | 3:30:00 |
| 35-39 | 3:05:00 | 3:35:00 |
| 40-44 | 3:10:00 | 3:40:00 |
| 45-49 | 3:20:00 | 3:50:00 |
| 50-54 | 3:25:00 | 3:55:00 |
| 55-59 | 3:35:00 | 4:05:00 |
| 60-64 | 3:50:00 | 4:20:00 |
| 65-69 | 4:05:00 | 4:35:00 |
| 70-74 | 4:20:00 | 4:50:00 |
| 75-79 | 4:35:00 | 5:05:00 |
| 80+ | 4:50:00 | 5:20:00 |
Meeting the qualifying standard does not guarantee entry. Boston uses a cutoff system where runners must beat their qualifying time by a certain margin depending on registration demand. In recent years, this cutoff has ranged from 0 to 7 minutes below the standard. The 18-34 age group faces the toughest competition, often requiring times 3 to 5 minutes faster than the listed standard.
For triathletes, Boston qualifying adds an extra challenge. The training required to hit a sub-3 or sub-3:30 marathon must be balanced against swim and bike volume. Many triathletes find that their marathon times plateau or even regress during heavy triathlon training blocks.
How to Improve Your Marathon Time
Understanding average marathon time by age and gender provides context, but most runners ultimately want to get faster. Improving your marathon time requires a structured approach to training, nutrition, and race execution. The following strategies have proven effective across all ability levels.
The 10-10-10 Rule
The 10-10-10 rule offers a simple pacing framework for marathon day. Run the first 10 miles at a controlled, conversational pace. Run the middle 10 miles at your goal marathon pace. Run the final 10K (6.2 miles) at whatever pace you have left in the tank. This approach prevents the common mistake of going out too fast and hitting the wall at mile 20.
Most marathon blow-ups happen in the first 10 miles. Adrenaline, fresh legs, and crowd excitement push runners 30 to 60 seconds per mile faster than their training suggests. This early overexertion depletes glycogen stores and recruits fast-twitch muscle fibers that should be reserved for later. The 10-10-10 rule forces discipline when it matters most.
Build Aerobic Base
Marathon performance depends primarily on aerobic capacity. Long runs of 18 to 22 miles build the mitochondrial density and capillary networks needed to sustain effort for 26.2 miles. These runs should be 45 to 90 seconds per mile slower than goal marathon pace. Weekly mileage matters more than intensity for most recreational runners.
Aim for at least three 20-plus mile runs in the final 12 weeks before your marathon. The physiological adaptations from these long efforts take 10 to 14 days to fully manifest, so the final long run should occur two weeks before race day. For first-time marathoners, simply completing these distances builds the confidence and physical resilience needed on race day.
Practice Marathon Pace
Your body needs to know what marathon pace feels like. Include marathon-pace segments in long runs, starting with 4 to 6 miles at goal pace and building to 10 to 12 miles. These sessions teach your muscles and nervous system to fire in the specific rhythm required for your target time.
Tempo runs at lactate threshold pace (roughly half marathon to 10-mile race pace) improve your ability to clear lactate while running fast. These efforts should feel comfortably hard, around 7 to 8 out of 10 perceived effort. A 40-minute tempo run every 10 to 14 days provides significant aerobic benefit.
Strength and Mobility
Running economy determines how much oxygen you use at a given pace. Strength training improves economy by increasing tendon stiffness and muscle coordination. Two 30-minute strength sessions per week targeting hips, glutes, and core provide noticeable benefits without adding excessive fatigue.
Mobility work prevents the tight hips and calves that plague marathoners late in races. Dynamic stretching before runs and static stretching or foam rolling after runs maintains range of motion. Tight hip flexors are particularly problematic because they limit stride length and force other muscles to compensate.
Race Day Nutrition
The marathon depletes glycogen stores regardless of fitness level. Consuming 60 to 90 grams of carbohydrates per hour during the race prevents the dreaded bonk. Practice your fueling strategy on long training runs. Never try a new gel, drink, or food for the first time on race day.
Most runners need 500 to 700 milliliters of fluid per hour depending on conditions and sweat rate. Drinking to thirst generally works for efforts under 3 hours, but longer efforts require more systematic hydration. Electrolyte replacement becomes important in hot conditions or for heavy sweaters.
Set Realistic Goals
Use the age and gender tables in this article to set realistic targets. A 45-year-old woman with two years of consistent training should not arbitrarily aim for a sub-4-hour marathon if her half marathon times suggest 4:15 is more appropriate. Training for unrealistic goals leads to injury, burnout, or race day disappointment.
Consider your life circumstances when setting goals. Parents with young children, professionals with demanding jobs, or triathletes balancing three sports face time constraints that affect training capacity. A 4:30 marathon achieved on 40 miles per week represents a more impressive athletic achievement than a 3:45 marathon on 70 miles per week with no other responsibilities.
Frequently Asked Questions
What is a good marathon time by age and gender?
A good marathon time varies significantly by age and gender. For men under 40, a good time falls between 3:30 and 4:15. For women under 40, good times range from 4:00 to 4:45. Runners over 50 should add roughly 15 to 25 minutes to these benchmarks. Age-graded scoring systems suggest that a 70% age-graded performance represents good competitive level regardless of raw time.
How fast did Gordon Ramsay run the marathon?
Celebrity chef Gordon Ramsay has run multiple marathons with a personal best of 3:30:37 at the 2012 London Marathon. This time qualifies as a solid intermediate performance for a 46-year-old man. Ramsay has also completed several Ironman triathlons, including the Hawaii Ironman World Championship.
Is it true only 1% of people run a half marathon?
Yes, approximately 1% of the global population has completed a half marathon. In the United States, about 2 million people finish half marathons annually out of a population of 330 million, which represents roughly 0.6%. Marathon participation is even more exclusive, with approximately 0.1% of the population having completed a full marathon.
What is the 10-10-10 rule for marathons?
The 10-10-10 rule is a pacing strategy that divides the marathon into three segments. Run the first 10 miles conservatively at a conversational pace. Run the middle 10 miles at your goal marathon pace. Run the final 10K at whatever pace you have left. This approach prevents early overexertion and helps avoid hitting the wall at mile 20.
Final Thoughts
Understanding average marathon time by age and gender gives you the context needed to set realistic goals and appreciate your achievements. Whether you are a 25-year-old man chasing a sub-3-hour finish or a 55-year-old woman aiming for your first 26.2-mile completion, the data shows that finish times spread across a wide range. What matters most is not where you fall on the statistical curve but whether you are improving relative to your own potential.
Marathon running continues to grow in popularity, with more first-time runners tackling the distance every year. The sport has become wonderfully inclusive, welcoming everyone from 2-hour elites to 6-hour finishers who walk the second half. Your marathon journey is yours alone. Use the averages as reference points, train consistently, respect the distance, and enjoy the experience of crossing that finish line in 2026 and beyond.