Heart rate zones explained for athletes form the foundation of every effective triathlon training program. Whether you are preparing for your first sprint distance event or aiming for a Kona qualification, understanding how to train within specific heart rate zones transforms random workouts into purposeful, physiology-driven sessions that deliver measurable results.
After coaching hundreds of athletes through the Malibu Triathlon and consulting with exercise physiologists, I have seen the same pattern repeatedly. Athletes who train with zones progress faster, avoid burnout, and peak perfectly for race day. Those who ignore them often plateau, overtrain, or arrive at the starting line underprepared.
This guide breaks down everything you need to know about the five heart rate zones, how to calculate your personal ranges, and specific applications for swimming, cycling, and running. You will learn why Zone 2 feels harder as you get fitter, how the 80/20 rule structures your training week, and practical strategies for managing the unique challenges triathletes face across three disciplines.
Table of Contents
What Are Heart Rate Zones?
Heart rate zones are percentage-based ranges of your maximum heart rate that correspond to different exercise intensities. Each zone triggers distinct physiological adaptations, from building aerobic base to developing anaerobic capacity. Think of them as gears on a bicycle. Just as you would not climb a steep hill in your highest gear or descend in your lowest, you should not tackle every workout at the same heart rate intensity.
The five-zone model, popularized by sports scientists and adopted by virtually every endurance coach, divides your training intensity from recovery efforts to maximum output. Training zones are not arbitrary numbers. They reflect real changes in how your body produces energy, which fuel sources it uses, and what adaptations occur at the cellular level.
For triathletes specifically, heart rate zones solve a critical problem. How do you maintain consistent effort across three radically different sports? Your perceived exertion during a swim feels different than cycling or running. Heart rate provides an objective metric that translates across disciplines, allowing you to execute the same training stimulus whether you are in the pool, on the bike, or on the road.
The 5 Heart Rate Zones Explained
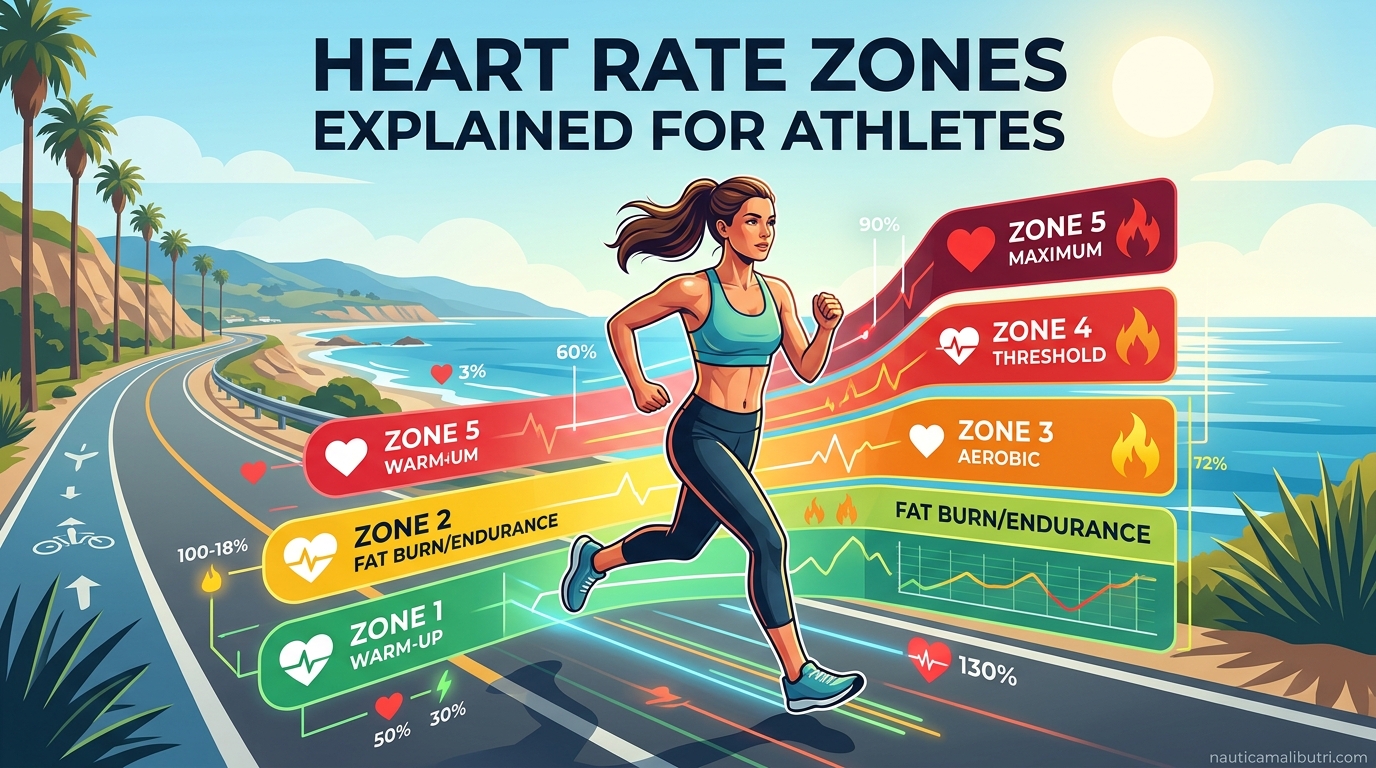
Each of the five heart rate zones serves a specific purpose in your training. Understanding what happens physiologically in each zone helps you choose the right intensity for your workout goals. The percentages below use maximum heart rate (MHR) as the baseline. Later sections cover how to determine your personal MHR accurately.
Zone 1: Recovery (50-60% of MHR)
Zone 1 represents very light activity where your body recovers while still moving. At 50-60% of maximum heart rate, you should feel like you could maintain this effort for hours without breathing hard. The primary benefit here is active recovery. Blood flow increases to muscles without stressing your cardiovascular system, helping clear metabolic waste from previous hard sessions.
Your body relies almost entirely on fat oxidation in Zone 1, with minimal carbohydrate usage. This makes it ideal for recovery days, warm-ups before intense sessions, and cool-downs after hard workouts. The conversation test works perfectly here. You should be able to speak in complete paragraphs without taking breath breaks.
Triathletes typically use Zone 1 during the first 10-15 minutes of any session to gradually elevate heart rate and prepare the body for harder work. It also serves as the intensity for recovery sessions between training blocks, particularly during taper periods before races.
Zone 2: Aerobic Base (60-70% of MHR)
Zone 2 is where the magic happens for endurance athletes. At 60-70% of maximum heart rate, you build aerobic capacity, increase mitochondrial density, and improve your body’s ability to burn fat for fuel. This zone should feel sustainable, conversational, and comfortable enough to maintain for 2-4 hours.
The physiological adaptations in Zone 2 are profound. Your body increases capillary density in working muscles, improving oxygen delivery. Mitochondria, the powerhouses of your cells, multiply and become more efficient at aerobic metabolism. You become better at sparing glycogen stores while utilizing fat, which is critical for Ironman-distance racing.
Elite coaches estimate that 70-80% of a triathlete’s annual training volume should occur in Zone 2. This seems counterintuitive to athletes who believe harder is always better. However, the aerobic base built in Zone 2 supports every higher-intensity effort. Without it, you cannot sustain Zone 3, 4, or 5 efforts effectively.
Zone 3: Tempo (70-80% of MHR)
Zone 3 represents moderate intensity where your body begins transitioning from aerobic to anaerobic metabolism. At 70-80% of maximum heart rate, you are working hard but sustainably. This is often called the “tempo” zone or “sweet spot” for many athletes because it provides significant training stress without the recovery demands of higher zones.
The conversation test changes in Zone 3. You can still speak, but only in short sentences. Breathing becomes noticeably heavier. Your body now uses a mix of fat and carbohydrates for fuel, with glycogen becoming increasingly important as intensity rises within this range.
Many coaches warn about the “gray zone” trap, where athletes spend too much time in Zone 3. While this zone has its place for tempo runs and sustained efforts, training here exclusively leads to mediocre fitness. You are working too hard to build aerobic base effectively, but not hard enough to trigger significant anaerobic adaptations. Use Zone 3 strategically, not habitually.
Zone 4: Threshold (80-90% of MHR)
Zone 4 is where serious training happens for competitive triathletes. At 80-90% of maximum heart rate, you are operating at or near your lactate threshold. The effort feels hard and requires concentration to maintain. Conversation becomes difficult to impossible. You might manage a few words between breaths.
This zone improves your lactate threshold, the point where your body produces lactate faster than it can clear it. Raising this threshold is crucial for Olympic-distance and Half Ironman racing, where you need to sustain high percentages of maximum effort for 2-6 hours. Training in Zone 4 increases your ability to tolerate and clear lactate, delaying fatigue.
Zone 4 workouts include threshold intervals, tempo blocks, and race-pace simulations. These sessions are physically and mentally demanding, requiring 24-48 hours of recovery afterward. Most age-group triathletes should limit Zone 4 work to 10-15% of weekly training time.
Zone 5: Anaerobic (90-100% of MHR)
Zone 5 represents maximum effort where your body operates anaerobically. At 90-100% of maximum heart rate, you are pushing at or near your VO2max, the maximum amount of oxygen your body can consume. These efforts are short, extremely uncomfortable, and require significant recovery.
The primary benefits of Zone 5 training include increased VO2max, improved neuromuscular coordination, and enhanced speed. While pure endurance athletes might minimize Zone 5 work, triathletes benefit from occasional high-intensity sessions. Sprint finishes, hill attacks, and surges during races require Zone 5 capacity.
Zone 5 efforts typically last 30 seconds to 5 minutes, depending on your training level. The rest intervals between repeats are long, allowing partial recovery before the next effort. Due to the high stress and recovery demands, Zone 5 should constitute less than 5% of annual training volume for most triathletes.
Heart Rate Zones Summary Table
| Zone | % of MHR | Intensity | Primary Fuel | Key Benefit | Triathlon Application |
|---|---|---|---|---|---|
| Zone 1 | 50-60% | Very Light | Fat | Recovery | Warm-up, cool-down, easy recovery days |
| Zone 2 | 60-70% | Light | Fat + Carbs | Aerobic base | Long rides, easy runs, base building |
| Zone 3 | 70-80% | Moderate | Carbs + Fat | Tempo fitness | Tempo sessions, Olympic-distance race pace |
| Zone 4 | 80-90% | Hard | Carbohydrates | Threshold power | Threshold intervals, Half Ironman pace |
| Zone 5 | 90-100% | Maximum | Carbohydrates | VO2max/Peak power | Sprint finishes, hill attacks, VO2max intervals |
How to Calculate Your Heart Rate Zones
Before you can train effectively in heart rate zones, you need to determine your maximum heart rate (MHR) and resting heart rate (RHR). These values allow you to calculate personalized zone ranges rather than relying on generic estimates that may be significantly off for your physiology.
The 220-Minus-Age Formula
The most common starting point for calculating maximum heart rate is the 220-minus-age formula. Subtract your age from 220 to estimate your MHR. For a 35-year-old athlete, this gives 185 beats per minute (220 – 35 = 185). From there, calculate zones using percentages. Zone 2 for this athlete would be 111-130 bpm (60-70% of 185).
However, this formula has significant limitations. Research shows it has a standard deviation of 10-12 beats per minute, meaning your actual MHR could be 10-20 beats higher or lower than the estimate. Genetics, fitness level, and gender all influence maximum heart rate beyond what age alone can predict.
Despite its inaccuracy, the 220-minus-age formula serves as a reasonable starting point for beginners who have no other data. Just understand it is an estimate, not a definitive number. As you gain experience, transition to more accurate methods.
The Karvonen Formula (Heart Rate Reserve)
The Karvonen formula, also called the Heart Rate Reserve method, provides more personalized zone calculations by incorporating your resting heart rate. This accounts for your individual fitness level, since fitter athletes typically have lower resting heart rates.
To use the Karvonen formula, first calculate your Heart Rate Reserve (HRR) by subtracting your resting heart rate from your maximum heart rate: HRR = MHR – RHR. Then for each zone, use the formula: Target HR = (HRR x Zone%) + RHR.
For example, a 35-year-old with an estimated MHR of 185 and resting HR of 50 would have an HRR of 135. Their Zone 2 range calculates as follows: Lower bound = (135 x 0.60) + 50 = 131 bpm. Upper bound = (135 x 0.70) + 50 = 145 bpm. Compare this to the standard 220-minus-age method which gave 111-130 bpm. The Karvonen method raises the targets significantly for this fit athlete.
Measure your resting heart rate first thing in the morning before getting out of bed. Take measurements over several days and use the average. Wearing a chest strap monitor or high-quality optical sensor overnight provides the most accurate data.
Field Testing for Accuracy
For the most accurate zone determination, perform field tests to establish your actual maximum heart rate and threshold points. These tests are physically demanding, so attempt them only when well-rested and cleared by a physician if you have any health concerns.
The simplest maximum heart rate test involves a 20-minute time trial. After a thorough warm-up, run or cycle as hard as you can sustain for 20 minutes. Your average heart rate during the final kilometer or last few minutes approximates your lactate threshold heart rate (LTHR). Multiply this by 1.05 to estimate your actual maximum heart rate.
A more comprehensive approach uses a ramp test. Following a warm-up, gradually increase intensity every 2-3 minutes until you cannot continue. The highest heart rate achieved represents your true maximum. This test is brutally hard but provides definitive data.
Some athletes prefer laboratory testing with gas exchange analysis and blood lactate sampling. While expensive, this provides the most precise zone boundaries based on your actual ventilatory and lactate thresholds rather than estimates.
Heart Rate Zones for Triathletes
Triathlon presents unique challenges for heart rate zone training. Three different sports with distinct biomechanics, muscle recruitment patterns, and environmental factors mean your zones do not transfer directly from one discipline to another. Understanding these differences helps you apply zone training effectively across swim, bike, and run.
Running Heart Rate Zones
Running typically produces the highest heart rates among the three triathlon disciplines. The weight-bearing nature of running, combined with the continuous muscle engagement required to support and propel your body, demands more cardiovascular output than cycling at the same perceived effort.
Most triathletes find their running heart rate at a given RPE (rating of perceived exertion) runs 5-10 beats per minute higher than cycling. A Zone 2 run might register 145-155 bpm while a Zone 2 ride at the same perceived effort shows 135-145 bpm. This difference is normal and expected.
Heart rate responds immediately to changes in running pace, making it an excellent real-time feedback tool. However, cardiac lag occurs during the first 2-3 minutes of any intensity change. Your heart rate continues rising for several minutes after you start running harder, even if you maintain constant pace. Account for this lag when starting intervals or tempo blocks.
Cycling Heart Rate Zones
Cycling heart rates typically run lower than running at equivalent effort levels. The seated position reduces cardiovascular demand, and the ability to coast or soft-pedal provides brief recovery opportunities even during steady efforts.
Bike setup significantly affects heart rate response. A poor bike fit that restricts breathing or creates inefficient power transfer will elevate heart rate at any given power output. Before establishing cycling zones, ensure your fit is dialed in by a professional.
Many triathletes now use power meters for cycling intensity alongside heart rate. Power responds instantly to effort changes, while heart rate shows a 30-60 second lag. The combination of both metrics provides the complete picture. Power guides the effort; heart rate confirms the physiological response.
Swimming Heart Rate Challenges
Swimming presents the most significant heart rate monitoring challenges for triathletes. Water pressure affects wrist-based optical sensors, often producing inaccurate readings or complete dropouts. Chest strap monitors work better but must be positioned carefully under a wetsuit or swimskin.
Even with accurate measurement, swimming heart rates typically run 10-15 beats per minute lower than running at the same intensity. The horizontal position improves venous return, the cool water may suppress heart rate slightly, and the breathing restrictions of swimming strokes limit maximum cardiac output.
Many experienced triathletes rely on perceived exertion and pace for swimming intensity rather than heart rate. If you do use heart rate for pool sessions, establish swimming-specific zones rather than applying your run or bike targets. A threshold test in the pool, timing yourself over a 400-800 meter time trial while recording heart rate, provides swim-specific data.
Brick Workouts and Transitions
Brick workouts, combining two disciplines with minimal rest between, create unique heart rate patterns. The most common format is the bike-to-run brick, simulating the second transition (T2) of a triathlon.
Your heart rate typically spikes in the first few minutes of the run after cycling. This occurs because your running muscles demand immediate blood flow, but your cardiovascular system is still operating in cycling mode. Blood pools in the legs temporarily, and your heart must work harder to maintain cardiac output until circulation adjusts.
Expect your run heart rate in the first mile off the bike to run 5-10 beats higher than it would at the same pace during a standalone run. Many triathletes start the run portion of bricks deliberately easy, allowing their heart rate to stabilize before settling into their target zone.
During races, this T2 heart rate spike can tempt athletes to panic and slow dramatically. Knowing this is a normal physiological response helps you maintain composure and appropriate pacing through the transition.
The 80/20 Rule and Zone Distribution
The 80/20 rule, also known as polarized training, has become the dominant approach among elite endurance athletes and coaches. The principle is simple: approximately 80% of your training time should occur at low intensity (Zones 1-2), while 20% should be at moderate to high intensity (Zones 3-5).
This distribution may seem surprisingly easy on the surface. Most triathletes, when left to their own devices, naturally gravitate toward the middle. They spend 60-70% of training in Zone 3, the “gray zone,” never going easy enough to build aerobic base effectively or hard enough to trigger significant anaerobic adaptations. The 80/20 approach corrects this imbalance.
Breaking down the 20% high-intensity portion, typical distributions allocate roughly 15% to Zone 3 (tempo), 4% to Zone 4 (threshold), and 1% to Zone 5 (VO2max). These are guidelines, not rigid rules. A sprint-distance specialist might emphasize Zones 4-5 more heavily, while an Ironman athlete focuses on Zone 2 volume with minimal high-intensity work.
Implementing 80/20 requires discipline, particularly on easy days. Athletes often feel they are wasting time running slowly or cycling at conversational pace. Trust the process. The aerobic adaptations from Zone 2 training provide the foundation that makes your high-intensity sessions possible. Without that base, you cannot reach your potential in Zones 3-5.
Track your zone distribution using training software or a simple spreadsheet. Review weekly and monthly averages to ensure you are maintaining the proper balance. Most athletes discover they have been training too hard on easy days and not hard enough on hard days.
Common Mistakes and Misconceptions
Even experienced triathletes make mistakes with heart rate zone training. Understanding these common errors helps you avoid the pitfalls that derail progress and cause frustration.
Why Does Zone 2 Feel Harder as You Get Fitter?
This is the most counterintuitive aspect of zone training and the question that generates the most confusion among developing athletes. As your fitness improves, Zone 2 efforts feel more difficult, not easier. Your breathing becomes heavier at the same heart rate that previously felt comfortable.
The explanation lies in the rate of adaptation between different physiological systems. Your cardiovascular fitness improves faster than your muscular endurance and mechanical efficiency. Your heart develops greater stroke volume, pumping more blood per beat, which should make exercise feel easier. However, your muscles, tendons, and movement patterns have not adapted at the same rate.
The result is a mismatch. Your cardiovascular system could handle a faster pace, but your legs cannot sustain it efficiently yet. You perceive the effort as harder because your muscles are working closer to their limit while your heart still has reserve capacity. This phenomenon resolves over months of consistent training as your muscular system catches up to your cardiovascular gains.
Another factor is unconscious pace escalation. As fitness improves, athletes naturally start pushing slightly harder without realizing it. What was previously a Zone 2 effort drifts into Zone 3 territory. Tracking your pace alongside heart rate helps identify this drift.
The ‘Gray Zone’ Trap
The gray zone, Zone 3, is where mediocre athletes live. This moderate intensity feels like a good workout. You are breathing hard, sweating, and feel accomplished afterward. However, from a training adaptation perspective, you are accomplishing little.
Zone 3 is too hard to build aerobic base effectively. You accumulate fatigue without triggering the mitochondrial and capillary adaptations that occur in Zone 2. It is also too easy to significantly improve lactate threshold or VO2max. You are working hard but not smart.
The gray zone is comfortable mentally. Going truly easy in Zone 2 feels too slow. Going truly hard in Zones 4-5 hurts too much. Zone 3 splits the difference, providing a satisfying workout without extreme discomfort. Resist this temptation. Make your easy days genuinely easy and your hard days genuinely hard.
220-Minus-Age Accuracy Concerns
Many athletes discover their actual maximum heart rate differs significantly from the 220-minus-age estimate. Some 40-year-old athletes max out at 190 bpm, while others of the same age cannot exceed 170. Both scenarios are normal.
If you have been training with zones calculated from the age formula and find Zone 4 efforts feel impossible while Zone 2 feels too easy, your actual MHR may differ from the estimate. Consider performing a field test or laboratory assessment to establish accurate zones.
Maximum heart rate also changes with fitness level, though less dramatically than resting heart rate. Detraining can reduce MHR slightly, while consistent training may allow you to reach higher peaks due to improved cardiac compliance and nervous system recruitment.
Environmental Factors and Heart Rate Drift
Your heart rate responds to factors beyond just exercise intensity. Environmental conditions, hydration status, and accumulated fatigue all affect how hard your heart works at any given pace. Understanding these influences helps you interpret your data correctly and adjust training accordingly.
Heat and Humidity Effects
Heat and humidity dramatically elevate heart rate at any given effort level. Your body must divert blood to the skin for cooling, increasing cardiovascular demand. In hot, humid conditions, expect your heart rate to run 5-15 beats per minute higher than in cool weather at the same pace.
This does not mean you are unfit or having a bad day. It is a normal physiological response to thermoregulatory demands. Adjust your zones or expectations accordingly. Many coaches recommend adding 5-10 bpm to zone thresholds when training in temperatures above 80 degrees Fahrenheit or high humidity.
Dehydration compounds heat effects. As you lose fluid, blood volume decreases, forcing your heart to beat faster to maintain cardiac output. A heart rate that drifts steadily upward during a long workout often signals dehydration rather than poor fitness.
Altitude Considerations
Training at altitude increases heart rate at submaximal efforts due to reduced oxygen availability. Your heart must pump more blood to deliver the same amount of oxygen to working muscles. Expect zones to shift 10-20 bpm higher depending on elevation.
Most triathletes training at sea level will notice elevated heart rates when traveling to altitude for training camps or races. This effect diminishes over 2-3 weeks as your body adapts through increased red blood cell production. However, maximum heart rate typically remains depressed at altitude compared to sea level.
Cardiac Drift Explained
Cardiac drift, also called heart rate drift, describes the gradual increase in heart rate that occurs during sustained exercise even when pace remains constant. Over the course of a 2-hour Zone 2 ride, your heart rate might start at 140 bpm and finish at 150 bpm despite holding identical power output.
Several factors cause cardiac drift. Core body temperature rises during prolonged exercise, increasing skin blood flow demands. Dehydration reduces plasma volume. Muscle fatigue requires recruitment of additional motor units, increasing oxygen demand. Catecholamine levels rise, stimulating heart rate.
Some cardiac drift is normal and expected, particularly in sessions lasting over 90 minutes. However, excessive drift indicates you are working harder than your target zone. During long workouts, allow your heart rate to drift upward 5-10 bpm, but adjust pace if it climbs beyond that range.
Frequently Asked Questions
Is zone 2 or 3 better for fat loss?
Zone 2 is better for fat loss because your body primarily burns fat for fuel at 60-70% of maximum heart rate. While Zone 3 burns more total calories, it relies more on carbohydrates. For optimal fat loss, spend 70-80% of training time in Zone 2 to maximize fat oxidation while managing hunger and recovery hormones effectively.
Is 220 minus your age accurate?
The 220-minus-age formula provides only an estimate with a standard deviation of 10-12 bpm. It does not account for fitness level, genetics, or gender. For more accuracy, use the Karvonen formula which includes resting heart rate, or perform a field test like a 20-minute time trial to establish personalized zones.
Why does zone 2 get harder as you get fitter?
Zone 2 feels harder as fitness improves because your cardiovascular system adapts faster than your muscles and connective tissue. While your heart pumps more blood per beat requiring fewer beats, your legs may not have adapted to the same intensity. This mismatch creates higher perceived exertion. Additionally, you may unconsciously push harder as fitness improves, drifting into Zone 3 territory.
What are the heart rate zones for triathlon training?
Triathlon training uses five zones: Zone 1 (Recovery, 50-60% max HR) for warm-ups and cool-downs; Zone 2 (Aerobic, 60-70%) for base building and long sessions; Zone 3 (Tempo, 70-80%) for aerobic capacity; Zone 4 (Threshold, 80-90%) for lactate tolerance; Zone 5 (Anaerobic, 90-100%) for VO2max work. Follow the 80/20 rule: 80% of training in Zones 1-2, 20% in Zones 3-5.
What is the 80/20 rule in triathlon?
The 80/20 rule states that triathletes should spend approximately 80% of training time at low intensity (Zones 1-2) and 20% at moderate to high intensity (Zones 3-5). This polarized approach maximizes aerobic development while providing sufficient stimulus for performance gains. Most age-group athletes naturally train in the gray zone, doing too much moderate work and not enough easy or hard training.
Can you train in zone 3 too much?
Yes, excessive Zone 3 training is a common mistake called the gray zone trap. Zone 3 is too hard to build aerobic base effectively and too easy to significantly improve lactate threshold or VO2max. Athletes spending too much time in Zone 3 accumulate fatigue without optimal adaptations. Limit Zone 3 to about 15% of weekly training time, focusing instead on truly easy Zone 2 and truly hard Zone 4-5 work.
How often should you retest your heart rate zones?
Retest your heart rate zones every 3-4 months during active training periods, or whenever you notice consistent discrepancies between perceived exertion and target zones. Significant fitness gains, weight changes, or returning from extended breaks all warrant retesting. Many athletes test at the beginning of each training season and adjust zones as they progress through base, build, and peak phases.
Conclusion
Heart rate zones explained for athletes provide the structure that transforms random activity into purposeful training. By understanding the five zones, calculating your personal ranges, and applying them consistently across swim, bike, and run, you take control of your triathlon preparation with scientific precision.
The key principles are simple but require discipline. Spend 80% of your time in Zones 1-2, building the aerobic base that supports everything else. Reserve 20% for harder work in Zones 3-5, where you develop threshold power and anaerobic capacity. Avoid the gray zone trap where too many athletes linger, working moderately hard without optimal results.
Remember that zones are tools, not shackles. Environmental conditions, fatigue, and daily stress all affect your heart rate. Learn to interpret the data in context, adjusting expectations when heat, humidity, or accumulated training load shifts your responses. With practice, heart rate zone training becomes intuitive, guiding you to the right intensity for every session.
Whether you are targeting your first sprint finish or chasing a podium at the Nautica Malibu Triathlon, training with heart rate zones delivers results. Start with the calculation methods outlined here, test your zones through field assessments, and commit to the 80/20 distribution. The fitness you build will carry you through every discipline and across any finish line.